How to use Google Analytics – and why you should
27 October 2014 By Northern Lights

 The last year has been a tipping point for businesses – few now dismiss social media as a nonsense, most are pretty enthusiastic about LinkedIn and most are using or trying to use other social media such as Twitter and blogging.
But in the last month I have been asking businesses, ‘who is using Google Analytics?’ (I’ve given talks to around 200 people in just the last month). Typically only one or two hands go up.
Now I have to say, I think Google Analytics is one of the most un-instinctive tools ever created. I don’t like the tool itself – but I love the data it provides. And so should you.
This blog is written for all those people who asked ‘what is Google Analytics’ and ‘how should I use it?’. It is an essential ‘starter for ten’ rather than a comprehensive guide. Get yourself started at a quiet time – a Saturday morning with the phones turned off – and dig down into the data. Once you start, you will be hooked!
1. What is Google Analytics?
Google Analytics is a service from Google which gives you detailed statistics about the traffic to your website – which pages visitors are landing on; which country (or town) they come from; whether they used a mobile device; which pages are most popular and the best times of day and best days for your traffic.
The basic service is free and you do need to register your website to this. Here are the categories of what you can search on Google Analytics (you will see what I mean about it not being very instinctive? But don’t be put off).
2. Measure blog traffic
Of course, while it is a useful tool for websites, the most valuable aspect for many businesses is to track the success of different blog posts. You can check out different blog titles and see the absolute traffic to each one, how long people stayed reading and what pages they then clicked on to – if any.
If you look at the report below for our own website (our blog is linked into our website) it is showing the most visited pages over this particular period.
What are we interpreting from all this?
By far the most popular blog on our site is one that our associate, Jonny Ross, wrote as a guest blog on ‘what is a good bounce rate?’ It is a question that clients often ask – and that is often a clue as to what will make a good blog topic. You can bet others are searching on this. If you do a Google search for this phrase, you will see Northern Lights comes top of Google because of this blog (thanks Jonny!)
Our blog on ‘how to build a successful intranet’ is 18 months old but still driving traffic – again it is at the top of Google for this search
Also still performing well though they are all at least six months old, are
- Where should internal communications sit?
- Building social media into stakeholder engagement strategy
- How to create a social media strategy for universities
Northern Lights is at the top or second top for all these on Google searches
- I am also thinking about the implications of the topics that people are searching – we are doing a lot with universities and these stats say that ‘how to create a social media strategy’ is probably exercising their minds – so we should maybe package more services for universities in this area
- And maybe we should be looking at more services/products around internal communications?
So if you monitor traffic you can analyse
- Most popular topics
- What people are searching for – and maybe what services and products you should be offering
- Topics that you could write more on – if these subjects are already popular, why not capitalise on knowing this and write around them in more depth?
3. Track website traffic over time periods
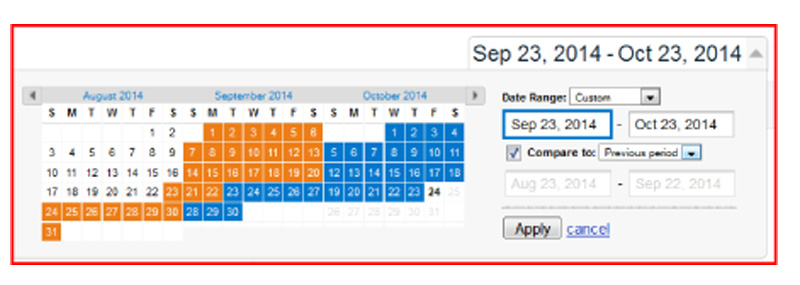
You can set the timeframe to analyse traffic. Typically you might look at the last month, or over the year and you can also compare to
- The previous period – so if you are looking at one month, compare to the previous month
- Or to the same timeframe across the previous year
You can then get charts showing these comparisons – a quick way to see how you compare, year on year and also drill down into days that are showing spikes. What did you do on these dates that suddenly increased traffic – was it the topic, did it go viral on Twitter, did you put more effort into promoting it?
4. Where does your website traffic go to next?
If you click on ‘Behavior Flow’ you get a fantastic chart that tells you what page visitors landed on and where they went to on your site next.
This is one of those areas where we don’t spend enough time analysing the data for ourselves – if we were more disciplined then we would be thinking how do we drive traffic to click on one of our workshops (for instance) or look at our services – say for internal communications.
To read more about Google Analytics – and for more details on some of the ‘how to dos’, here are further articles that look helpful
- The Guardian blog by Joanna Geary
- Social Media Examiner has a great blog on what all the terms mean on Google Analytics and lots of detail on how to use various functions
- The Chartered Institute of Public Relations (CIPR) recently published an excellent and comprehensive guide by CIPR Social Media Panel member Andrew Bruce Smith MCIPR on how to use Google Analytics for PR measurement and evaluation
And when you are ready to get into the real nitty gritty, have a look at
- 9 Awesome things you can do with Google Analytics 5 – but there is an awful lot you can do with the basic tools before you will benefit from this level of analysis!


